Understanding data discrepancies across different analytics tools
05 Aug 2017When data is inconsistent it’s difficult to trust. Especially in early stage companies where datasets are usually small, a small data inconsistency could skew a hypothesis towards an invalid assumption. In this post, I will try to highlight some common reasons for data discrepancies and provide a few tips on how we can avoid them as much as possible.
Google Analytics
Google Analytics is the most popular analytics tool for startups and therefore most of the data inconsistencies appear when we’re comparing Google Analytics with another tool. A detailed comparison between Google Analytics and other tools is outside of the scope of this post. Instead, I’ll try to capture the most common reasons that lead to data inconsistencies when comparing any tool to Google Analytics.
Ensure tracking codes are set up correctly
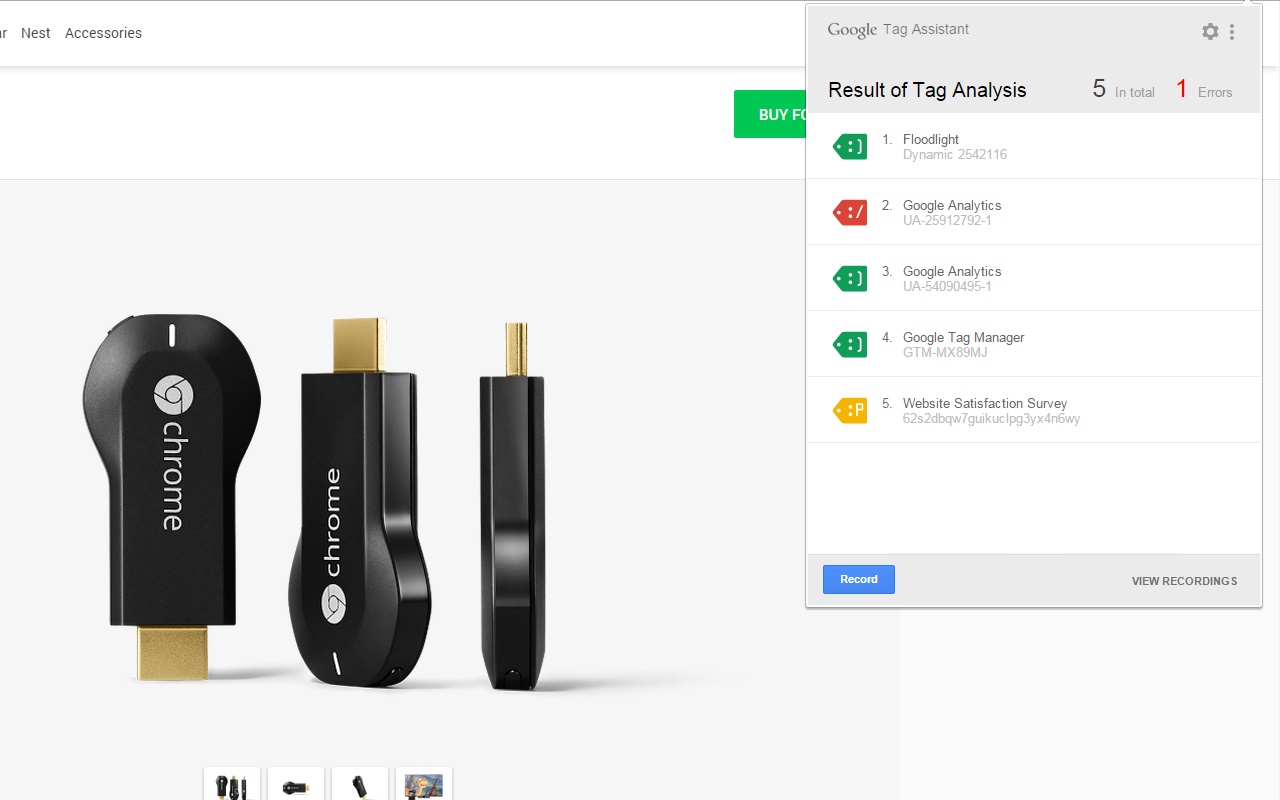
This sounds obvious, but it is by far the most common reason for inconsistent data across different analytics tools. Whether you’re adding tracking codes directly to your product or using a tool like Google Tag Manager, make sure the tracking events are fired-up properly. Depending on the platform your product is built on, you have a few options on how to test for errors.: For websites, Google has released Google Tag Assistant, a Google Chrome plugin that helps you identify tracking code errors. In addition to listing out all the analytics events fired on the current page along with their properties, this plugin will notify you of any errors regarding duplicate codes or incorrect placement.
For iOS applications, you can use a Google Analytics SDK dryRun flag in combination with a custom logger to debug all analytics calls without affecting your actual metrics. Make sure to disable dryRun as soon as you ensure that your analytics calls are firing up properly.
Similarly, for Android applications, you can use the Google Analytics SDK dryRun flag. The SDK will log all calls on logcat under the GAv4 tag.
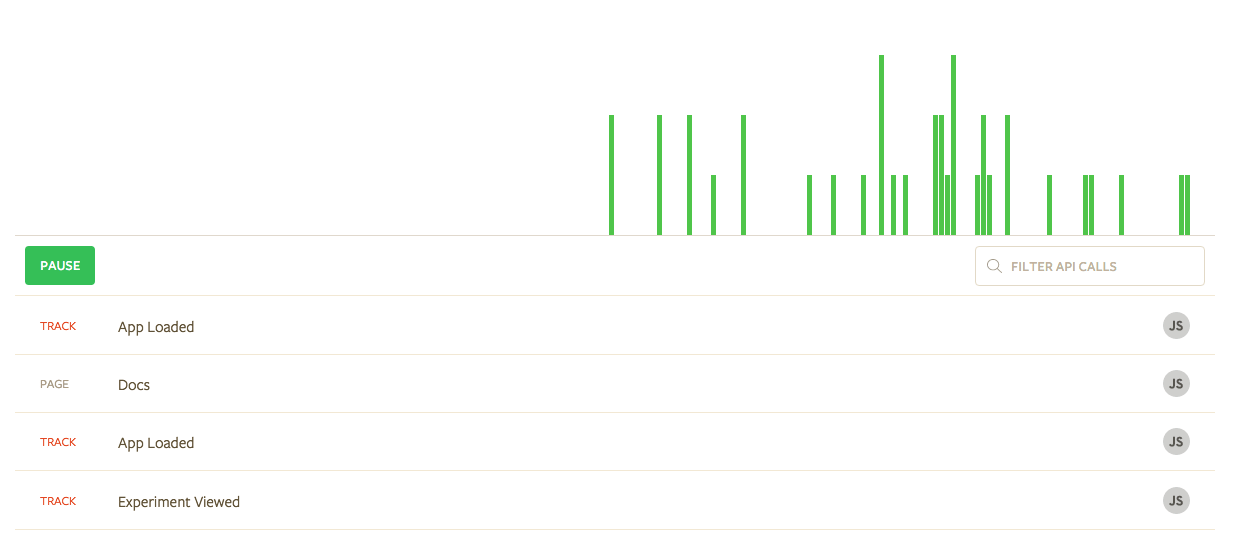
Alternatively, you can use Segment, a tool that collects all of your analytics calls and handles the delivery to third party analytics tools automatically. Segment has a very useful, real time, debugger which makes debugging analytics on any platform easy.
Ensure you’re using the same time zone settings on every tool
Some analytics tools use the user’s location time zone by default, while others default to Eastern Time (ET). This is important as the time zone you select affects the day boundary for reports. If you select Eastern Time, the start and end of a day is determined by Eastern Time.
Ensure you’re filtering traffic consistently across all tools
It is very common to use Inclusion and Exclusion filters in Google Analytics in order block unwanted traffic (internal traffic, spam referrals, bots etc). If you’re using any kind of filters, make sure to use the same filtering logic across all tools.
Understand data sampling
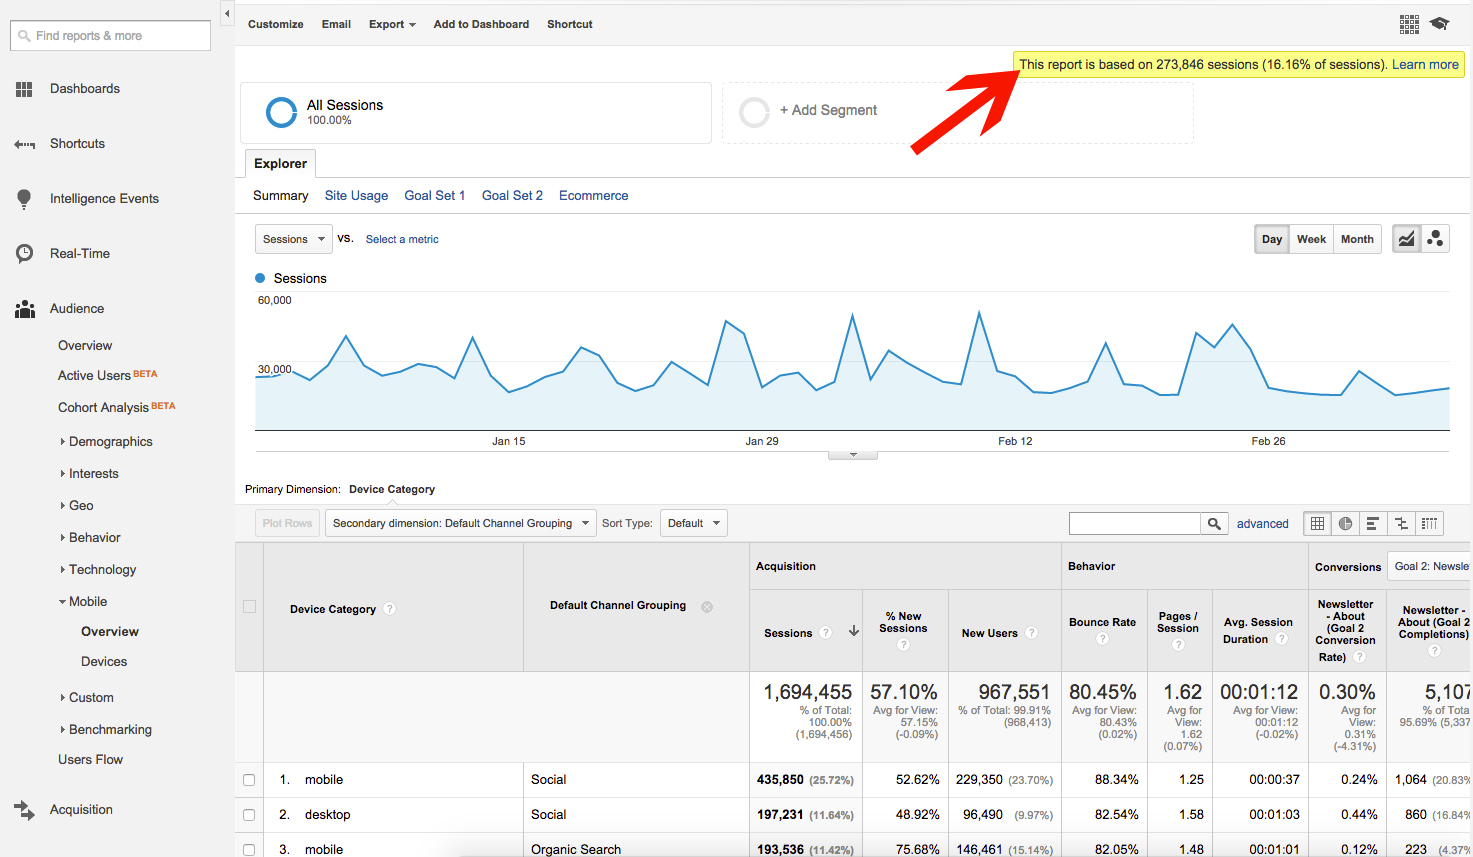
Data sampling is a statistical analysis technique used to analyse a representative subset of data without having to analyse the whole dataset. This is probably a smaller concern if your site or app doesn’t receive a high level of traffic (less than ~1000 sessions/month). Google analytics use data sampling when reporting datasets with more than 500.000 sessions over the selected timeframe and it’s indicated with a yellow warning on the top right corner of the requested report.
If the sampled results are not accurate, you can either change the precision/speed ratio or reduce the selected timeframe to avoid data sampling altogether.
Understand the impact of Ad blocking
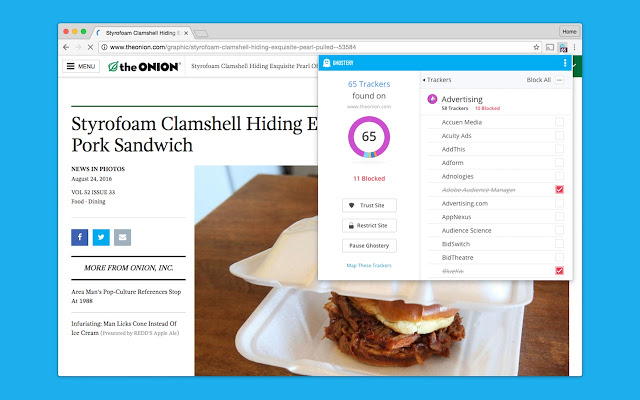
Ad blockers are browser extensions that block selected third party tracking libraries and ads from executing on the page.
While most people think that Ad blockers only block ads, it is important to understand that they also block client side analytics and retargeting scripts and conversion tracking pixels. We’ve seen a significant increase in ad blocker usage after Apple released iOS 9 which enabled support for third party ad blocking apps for Safari, where users use them in order to reduce their data consumption. That said, depending on your audience, the impact of ad blocking could vary greatly.
In order to avoid getting blocked by ad blockers, you can either nicely ask the users to whitelist your website, or send the most important events server side.
Understand how attribution models work
Comparing attribution and conversion tracking metrics across different tools is tricky and it’s fairly typical for conversions to be off by at least 10-15%. This is due to a number of factors, but most importantly due to cross device conversions and different attribution models. Unfortunately, there’s not much we can do to affect those metrics but it’s important to understand why this happens.
Cross device conversions
Cross device conversions are counted when people click on an ad on one type of device (or browser), and then complete a conversion goal on a different type of device. Usually that means clicking on an ad on a mobile phone but completing the transaction on desktop but cross-browser conversions can often happen on the same device. Historically, Facebook Ads conversion reporting is more accurate, mostly because it ties the user journey to a specific user across many devices instead of relying on cookies and referrer URLs, which is how Google Analytics credits conversions back to ads. Recently, Google AdWords announced cross device conversion tracking for search and shopping campaigns, which means the conversion gap will reduce even further.
Different attribution models
The default models for conversion attribution varies significantly between Google Analytics and Facebook Ads, which almost always leads to inconsistent reports.
Google Analytics simply attributes 100% of the conversion value to the last channel before converting (except direct traffic). That practically means that it only tracks conversions on a straight line: Clicked Ad > Completed goal.
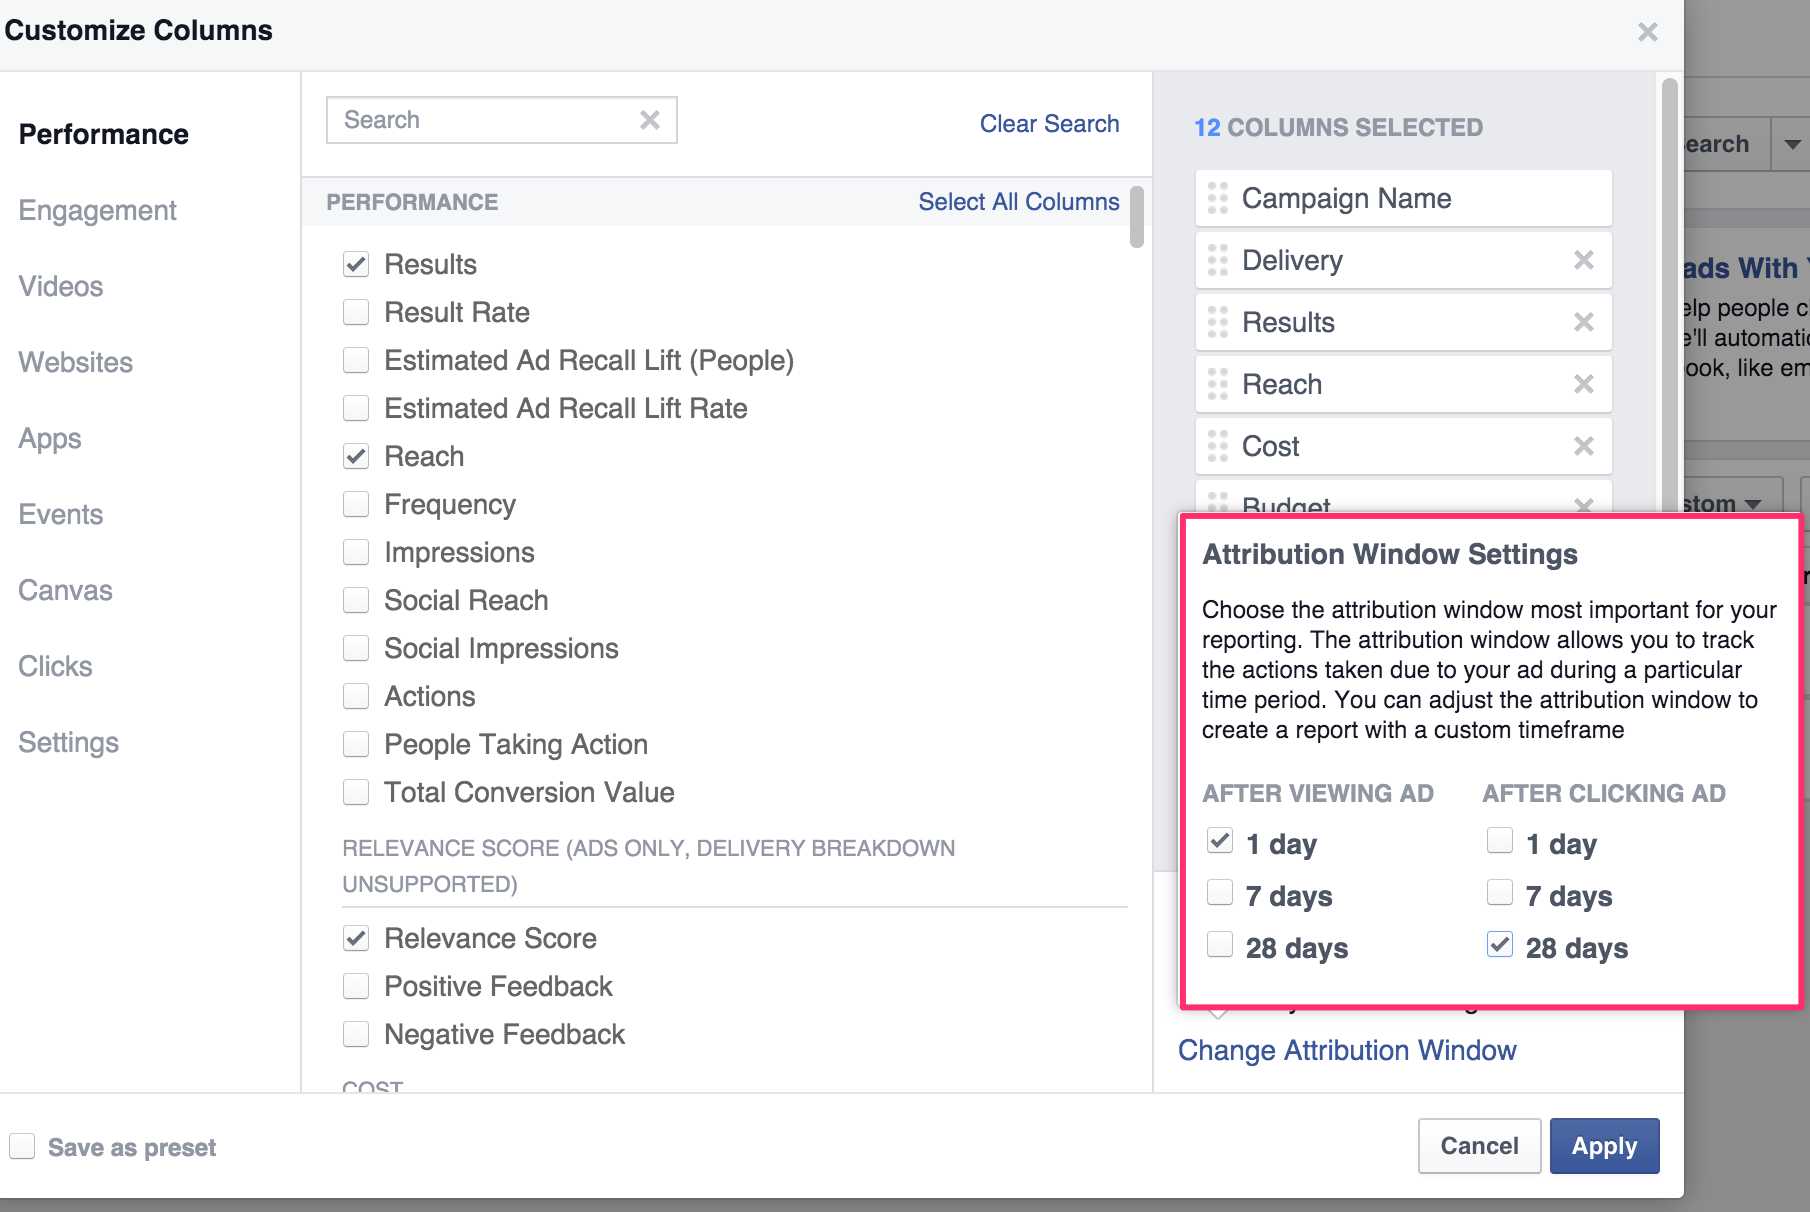
Facebook is slightly more generous with either 24 hour view through or 28 day click through. That practically means that the tracking process is slightly more complicated but also more accurate: Viewed (but not clicked) Ad > Completed goal 3 hours later by visiting the site Clicked Ad > Left site > Completed goal 5 days later
While these are the default model attribution settings, it is possible to change the model on both tools to better reflect the multi channel attribution behaviour.
Send your most important events server side
While it is fairly acceptable to have small data inconsistencies some metrics and data are more important than others. For instance, it may be ok to have a 3% data inconsistency on conversion rate metrics reporting, but it’s not acceptable to have inconsistencies in e-commerce revenue reporting.
Similarly, if you’re using a marketing automation tool like Drip to onboard and assign users to specific workflows, you need to make sure that the events to create the users on the 3rd party platform are firing up consistently. In these cases, you should use server side events to ensure you have 100% data accuracy.
Use Segment
Segment is a tool that collects your customer and metrics data, prepares and translates it into a format each tool understands and sends the data to your designated integrations, eliminating the need to add custom analytics and tracking codes for each marketing tool. Using a tool like Segment, helps you reduce the chance of integration errors but also gives your marketeer full control to try out new tools in a cost effective way.
Hopefully these tips will help you understand the reason behind data discrepancies and give you a few suggestions on how to protect against them. While it’s possible you’ll never reach 100% data accuracy, understanding why that happens and at least having a consistent error margin will help you make data-driven decisions with more confidence.